Think of the market as a giant mood ring where its shade shifts with response to headlines, earnings reports, or shifts in investor sentiment day by day. The Fear and Greed Index captures that emotional pulse, mapping where collective caution ends and risk appetite begins on a simple 0-to-100 scale.
By tracking seven sentiment signals for stocks, along with a five-signal gauge for crypto, it can provide a quick read on whether investors are selling due to fear or buying due to greed. In this guide, you will learn what the Fear and Greed index measures, what signals decide the change in the index, the Fear and Greed index in crypto, stocks, and references to check updates.
The Fear and Greed Index is a widely recognized measure of investor sentiment, developed by CNN Business. It aims to quantify the emotions—primarily fear and greed—that drive buying and selling activity in the stock market. The index is based on the idea that excessive fear might cause stocks to be undervalued, while excessive greed might push prices beyond reasonable levels.
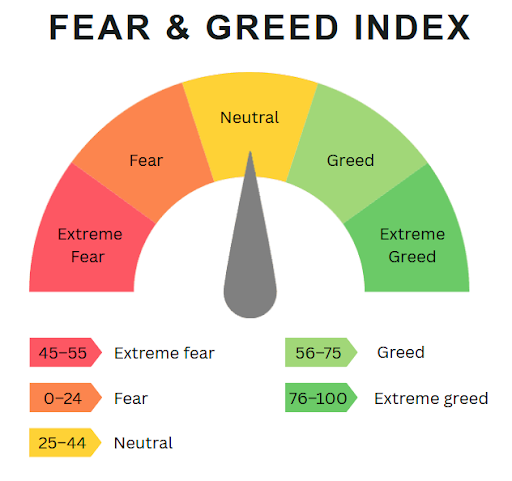
The index is scored on a scale from 0 to 100, where:
0–24: Extreme fear
25–44: Fear
45–55: Neutral
56–75: Greed
76–100: Extreme greed
This spectrum helps you understand whether the market is currently being driven by fear, greed, or a more balanced sentiment. Developed by CNN Business, the index blends seven equally weighted signals. Let us understand them in detail.
How is the Fear & Greed Index calculated?
CNN Business normalizes seven sentiment signals, scores each from 0 (Extreme Fear) to 100 (Extreme Greed), then averages them for the stock market Fear and Greed index. All seven inputs carry equal weight so that no single indicator can dominate the result. Here’s how each component works:
1. Stock price momentum
This metric compares the S&P 500 to its 125-day moving average. When the index sits well above that average, it suggests buyers like you may be growing optimistic, pushing the momentum component toward greed. A slide below the average tilts the needle toward fear.
2. Stock price strength
Here, the model tallies how many NYSE stocks hit 52-week highs versus 52-week lows. More fresh highs than lows point to broad confidence (greed); the opposite signals caution (fear). Think of it as a breadth check on leadership names versus laggards.
3. Stock price breadth
This indicator tracks the volume of shares traded in stocks that are rising versus those that are falling on the NYSE. If you notice that more volume is being directed towards rising stocks, it may indicate broader market participation and increased buying activity.
On the other hand, when more volume is concentrated in declining stocks, it could signal heavier selling and a shift in sentiment toward caution or fear.
4. Put and call options
The five-day average of the CBOE (Chicago Board Options Exchange) total put/call ratio tracks whether traders are snapping up more downside protection (puts) or upside bets (calls). A spike in put buying is common when you and other investors grow anxious, driving this indicator lower toward fear. A call-heavy market may shift it upward toward greed.
5. Junk bond demand
High-yield bonds typically pay more than Treasuries to compensate for added credit risk. The index measures the yield spread between junk bonds and investment-grade paper. A wider spread might indicate that investors are demanding extra safety (fear). In contrast, a narrow spread suggests you and other market participants are comfortable reaching for yield (greed).
6. Market volatility
Here, the benchmark is the CBOE Volatility Index (VIX) compared to its 50-day moving average. Elevated or rising volatility often accompanies uncertainty and therefore lowers the score toward fear. A subdued VIX might push this toward higher greed.
7. Safe haven demand
Finally, the model looks at the prior 20-day returns of Treasury bonds versus stocks. When treasury bonds outperform, it may imply a flight to safety and push the overall Fear and Greed index lower. If equities outpace bonds, the needle shifts toward greed, inclining towards a stronger risk appetite.
Check out this comprehensive table on what each signal suggests and why it matters to you:
Component
What do you watch?
Why does it matter to you?
Momentum
S&P 500 distance from 125-day MA
A wide gap above the average often signals your growing optimism.
Strength
52-week highs vs. lows
More highs than lows show broad confidence.
Breadth
Up-volume vs. down-volume
Heavy buying volume pushes the needle toward greed.
Options
Put/Call ratio
More suggests that you and other traders seek protection (fear).
Credit spread
Junk vs. IG yields
A widespread preference for safety.
Volatility
VIX vs. 50-day MA
Rising VIX often marks uncertainty.
Safe havens
20-day Treasuries vs. stocks
Outperformance of bonds implies a flight to safety.
Fear and Greed Index – Stocks
The stock market Fear and Greed index gives you a single number that sums up how investors feel on Wall Street today. Because the seven signals utilize data such as S&P 500 prices, options activity, and the yield gap between junk bonds and Treasuries, they primarily reflect the actions of pension funds, hedge funds, and insurers.
In other words, the reading lets you see how large institutions strike a balance between risk and safety on any given day.
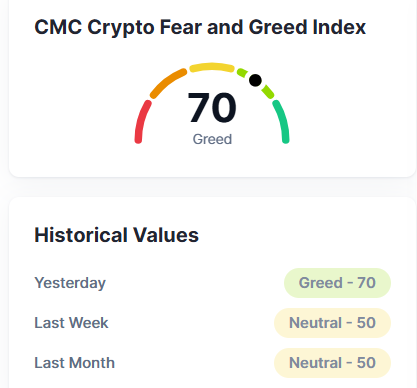
Fear and Greed Index – Crypto
The crypto Fear and Greed index relies on five high-frequency signals that capture retail psychology rather than institutional flows:
Crypto input
What does it track?
Why does it move fast?
Volatility
30- and 90-day price swings
Major headlines or security problems can quickly widen daily price swings
Market Momentum & Volume
Spot and derivatives turnover
Buying and selling by individual traders can change suddenly
Social-Media Sentiment
X/Twitter, Reddit, Telegram
Online posts increase within minutes of new information
Bitcoin Dominance
BTC share of total crypto cap
When money moves from Bitcoin into other coins, it often shows higher risk-taking
Google Trends
Search interest in “buy bitcoin,” etc.
Search interest from everyday investors jumps when the topic goes viral
Historical examples of the Fear and Greed index
Take a look at moments when sentiment readings and market moves told different stories.
March 23, 2020 – Stocks, Index at 12 (Extreme Fear): The COVID-19 crash pushed the Fear and Greed index to its lowest reading in years. Three trading days later, U.S. equities began a multi-month advance. The snap-back illustrates how panic can exhaust itself before fundamental stabilisation.
November 9, 2021 – Crypto, Index at 84 (Extreme Greed): One day after the crypto gauge flashed near-peak greed, Bitcoin rolled over and entered a months-long slide. Even though the index showed intense greed, Bitcoin soon fell, highlighting the limits of emotional barometers in fast-moving markets.
April 8, 2025 – Stocks, Index at 3 (Extreme Fear): Despite the grim reading, the S&P 500 bounced roughly 3% within a week. The rise suggests that a very low reading can indicate a short-term low rather than a prolonged decline.
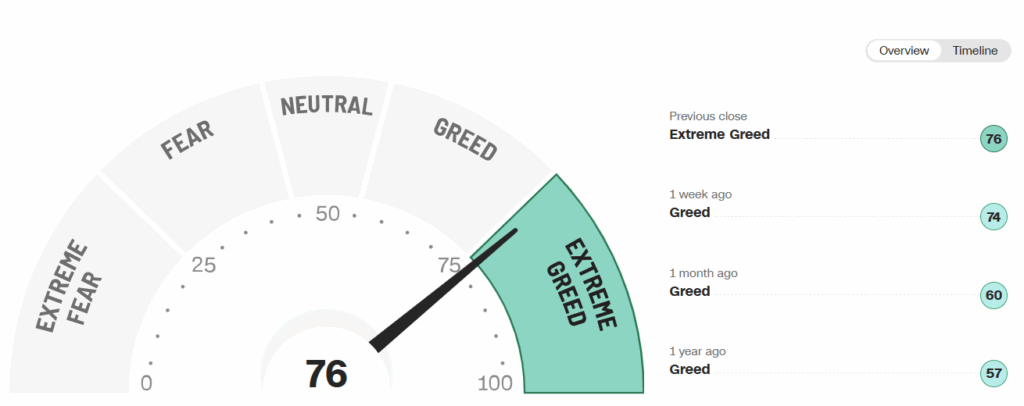
Where to track the Fear and Greed Index?
You won’t find one “official” formula for the Fear and Greed index, as different sites publish their own versions, so you will need to check a few trusted dashboards to see today’s mood.
Potential advantages of monitoring the Fear & Greed Index
Below are a few ways the Fear & Greed Index may add helpful context to the other market data you already watch.
1. May help gauge emotional extremes
When the score is below 10 or above 80, it may indicate that emotion is driving prices more than fundamentals.
2. May help contextualise market reactions to news
During March 2020’s pandemic panic, the Fear and Greed index sat in single digits for days, even as stimulus headlines began to hit. Watching that pattern can remind you that mood often flips before fundamentals settle.
3. May serve as a supplementary indicator
Pair the index with earnings reports, economic releases, or on-chain metrics if you follow this index’s crypto readings. In other words, the index may add context, but it may not serve as a stand-alone playbook.
Potential limitations of the Fear & Greed Index
Keep these cautions in mind so you don’t rely on the index more than it deserves.
1. Not based on fundamentals like earnings or forecasts
The Fear and Greed index does not include company earnings or economic forecasts. That means a low score can linger even when earnings beat estimates, or a high score can stick around when profits slow.
If you want a picture of fundamentals, you might still need to review income statements, forecasts, and macro data alongside the gauge.
2. May reflect short-term emotion, not long-term direction
Because the dial updates daily, it captures daily emotions, which can change overnight. One news headline can drag the score from “Greed” to “Fear” before the market opens. The effect is even sharper in the crypto Fear and Greed index. In short, the reading tells you how investors feel right now, not where prices will be a quarter from now.
3. Might be misinterpreted if used in isolation or without context
If you look at the number alone, you might assume a “Greed” reading means sell, or a “Fear” reading means buy. That single-indicator mindset might backfire. Treat the Fear and Greed index as one piece of a larger checklist, not as a green-light or red-light signal.
Conclusion
Understanding the Fear and Greed Index gives you a lens into how emotion may be influencing market behavior. While it’s not a forecasting tool, it might help you recognize shifts in sentiment that may impact how you interpret news, price moves, or investor behavior.
If you’re interested in exploring a wide range of investment options—including stocks, options, ETFs, crypto, treasuries, bonds and more—platforms like Public.com offer a user-friendly environment to build and manage a diversified portfolio. You can follow market sentiment, gain advance data and insights into companies metrics, that may support your investing journey—all from a single, easy-to-use platform.